
Barcelona's Perfect Start: Do the Numbers Tell the Same Story?
Eight matches, eight wins, 24 points. We analyse Barcelona's perfect start using xG, xPts and defensive statistics, comparing their performances with Real Madrid and Atlético Madrid.

Eight matches, eight wins, 24 points. FC Barcelona could hardly have asked for a better start to the 2026/27 La Liga season.
With their 3-0 victory over Getafe, Hansi Flick's side equalled the club's best ever start to a league campaign, previously achieved in 2013/14 under Gerardo Martino. A ninth consecutive victory against Real Betis on Saturday, 17 October 2026, would set a new club record and equal the La Liga record established by Real Madrid in 1968/69, according to FC Barcelona's official website.
The results are impressive. But how much do they actually tell us about Barcelona's performances?
A perfect record does not necessarily mean that every victory was equally convincing. Teams can win by consistently creating better chances than their opponents, but exceptional finishing and favourable outcomes can also contribute to their success.
To understand what lies behind Barcelona's remarkable start, we analysed their first eight league matches using attacking and defensive statistics, expected goals and expected points. We also compared their performances with Real Madrid and Atlético Madrid.
The aim is to distinguish between the strength of Barcelona's underlying performances and the extent to which their results exceed statistical expectations.
1. An attack built on more than exceptional finishing
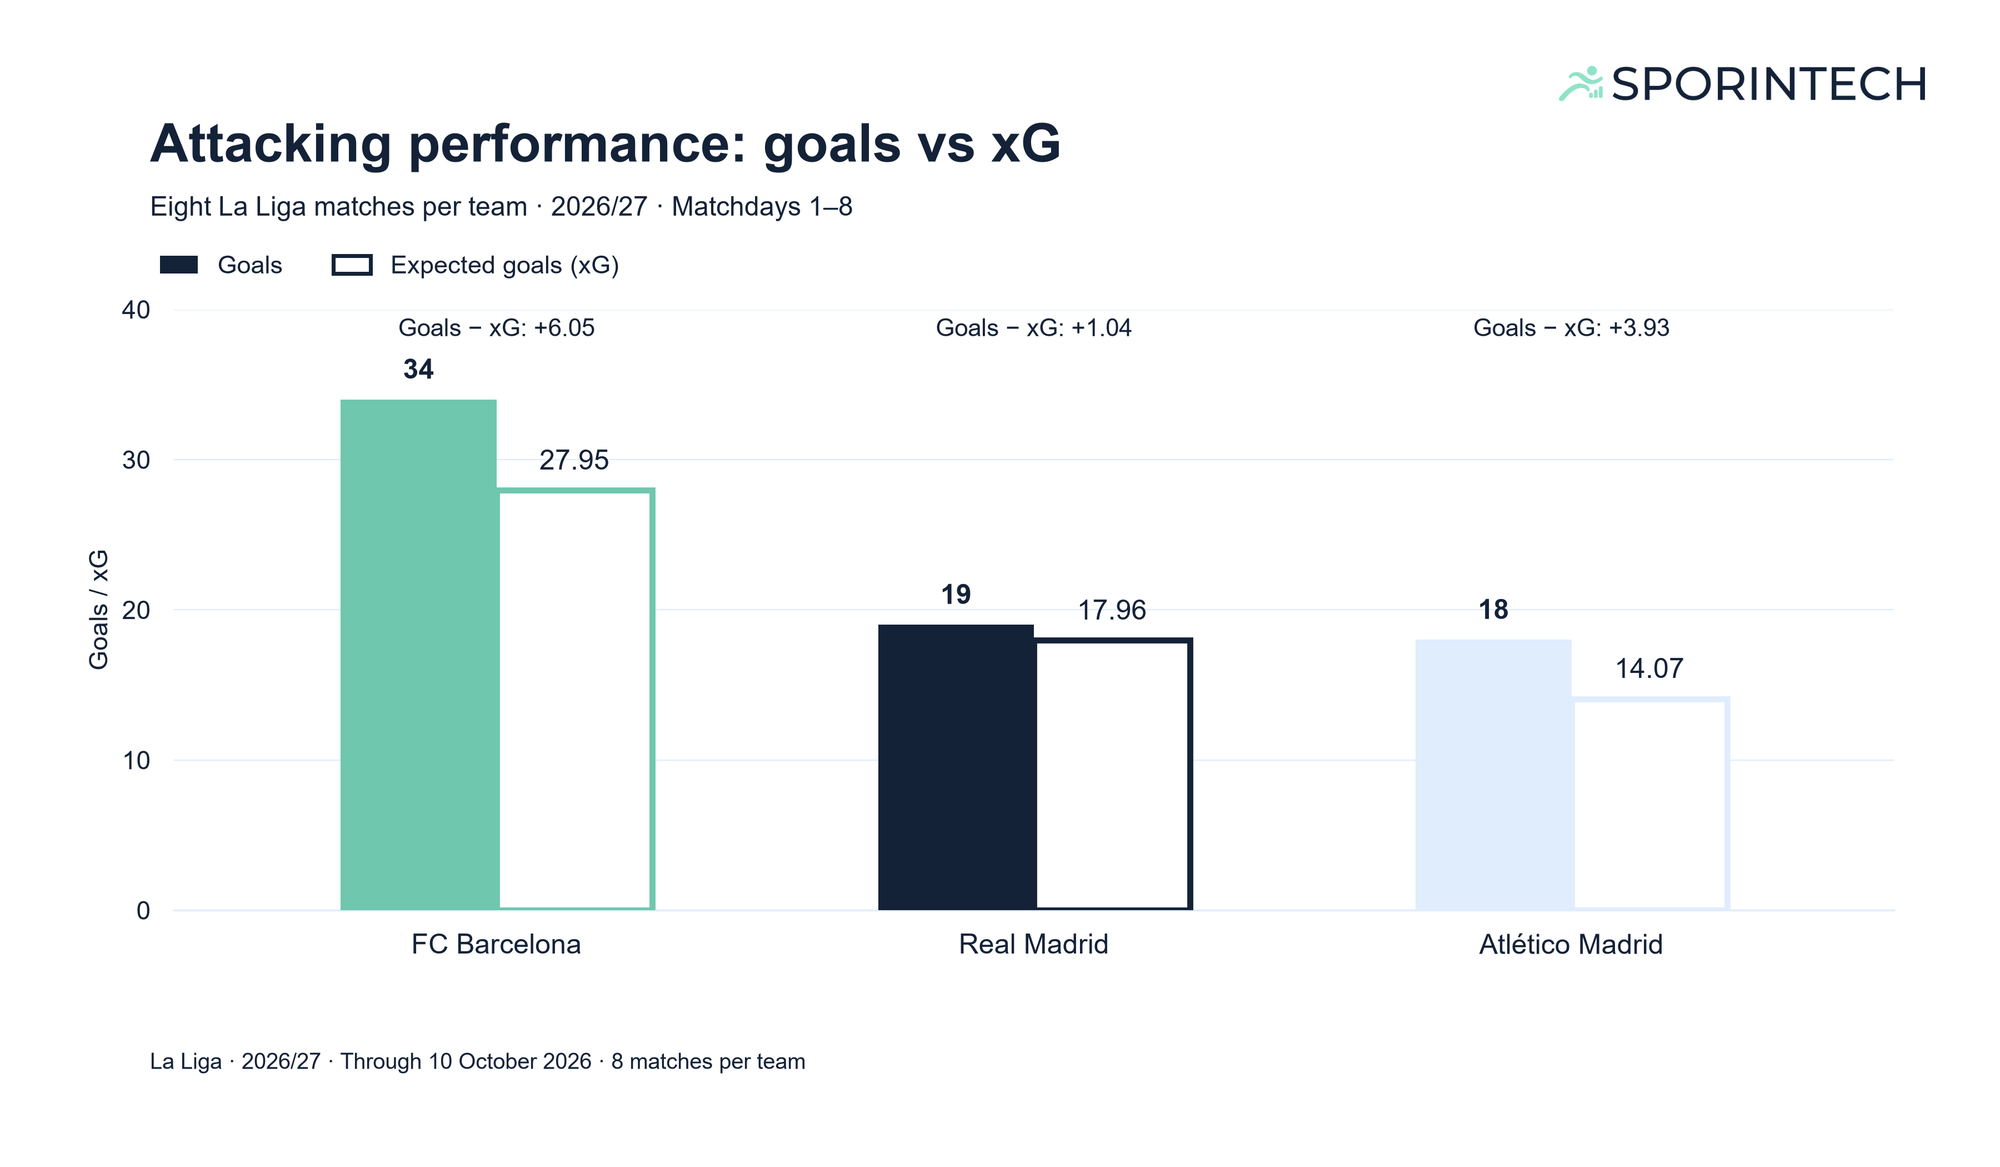
Barcelona have scored 34 goals in their opening eight league matches, an average of 4.25 per game. That is considerably more than Real Madrid's 19 and Atlético Madrid's 18 goals over the same number of matches.
But are those numbers supported by the quality of the chances Barcelona have created?
Expected goals, or xG, estimate how many goals a team would typically score based on the quality of its shooting opportunities. Factors such as shooting distance and angle help determine the probability of each chance resulting in a goal.
Across eight matches, Barcelona accumulated 27.95 xG, compared with 17.96 for Real Madrid and 14.07 for Atlético Madrid. These totals are calculated by adding together the expected goals recorded in each team's eight matches.
Figure 1 compares actual and expected goals across the three teams, illustrating both Barcelona's superior chance creation and the difference between their actual goals and xG.
This suggests that Barcelona's attacking advantage is not simply the result of an unusually high number of goals. Their underlying chance creation is also considerably stronger than that of the two comparison teams.
However, Barcelona's 34 actual goals exceed their xG by 6.05.
In other words, Barcelona have scored around six more goals than their chances would statistically suggest. This indicates that their goalscoring results have exceeded the model's expectations, although the difference alone does not establish whether this comes from superior finishing ability or short term variation.
2. More shots and better chances
Barcelona's attacking advantage becomes clearer when we separate shooting volume from chance quality.
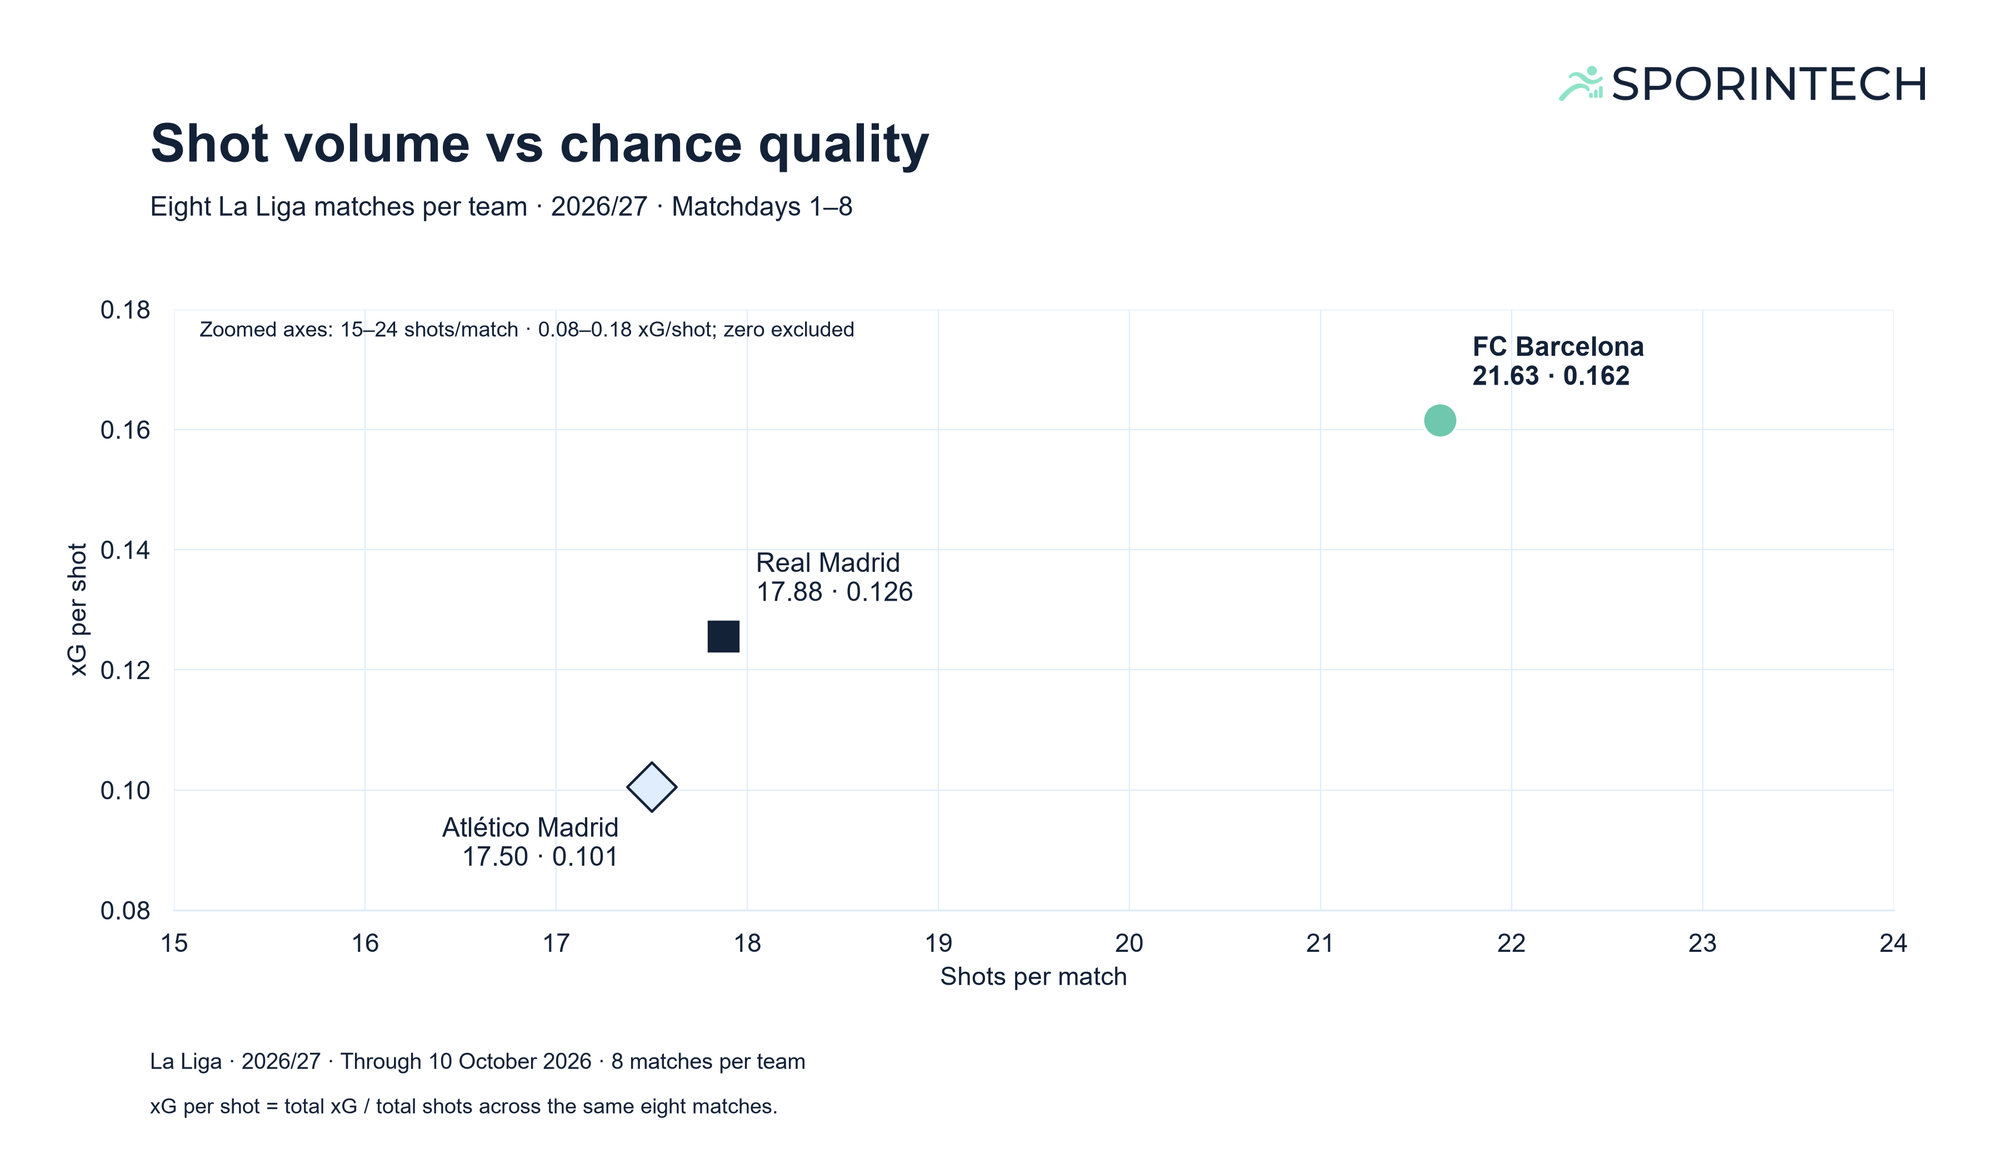
The team averages 21.63 shots per match, compared with 17.88 for Real Madrid and 17.50 for Atlético Madrid.
However, taking more shots does not automatically mean producing better scoring opportunities.
Barcelona attempted 173 shots across their eight matches. Dividing that total by eight gives an average of 21.63 shots per match.
To measure average chance quality, we divided Barcelona's total xG of 27.95 by those 173 shots. The result is 0.162 xG per shot, meaning that an average Barcelona attempt carried an estimated scoring probability of approximately 16.2%.
For comparison, Real Madrid recorded 0.126 xG per shot, while Atlético Madrid reached 0.101.
Figure 2 illustrates these differences, showing how Barcelona combines a higher shot volume with better average chance quality than the two Madrid clubs.
This distinction matters. Barcelona are not relying on shot volume alone. Within this comparison, they are both shooting more frequently and creating more dangerous opportunities on average.
The combination helps explain why their total xG is so much higher.
3. What about Barcelona's defence?
A strong attack can explain much of Barcelona's success, but a convincing assessment also needs to consider what happens at the other end of the pitch.
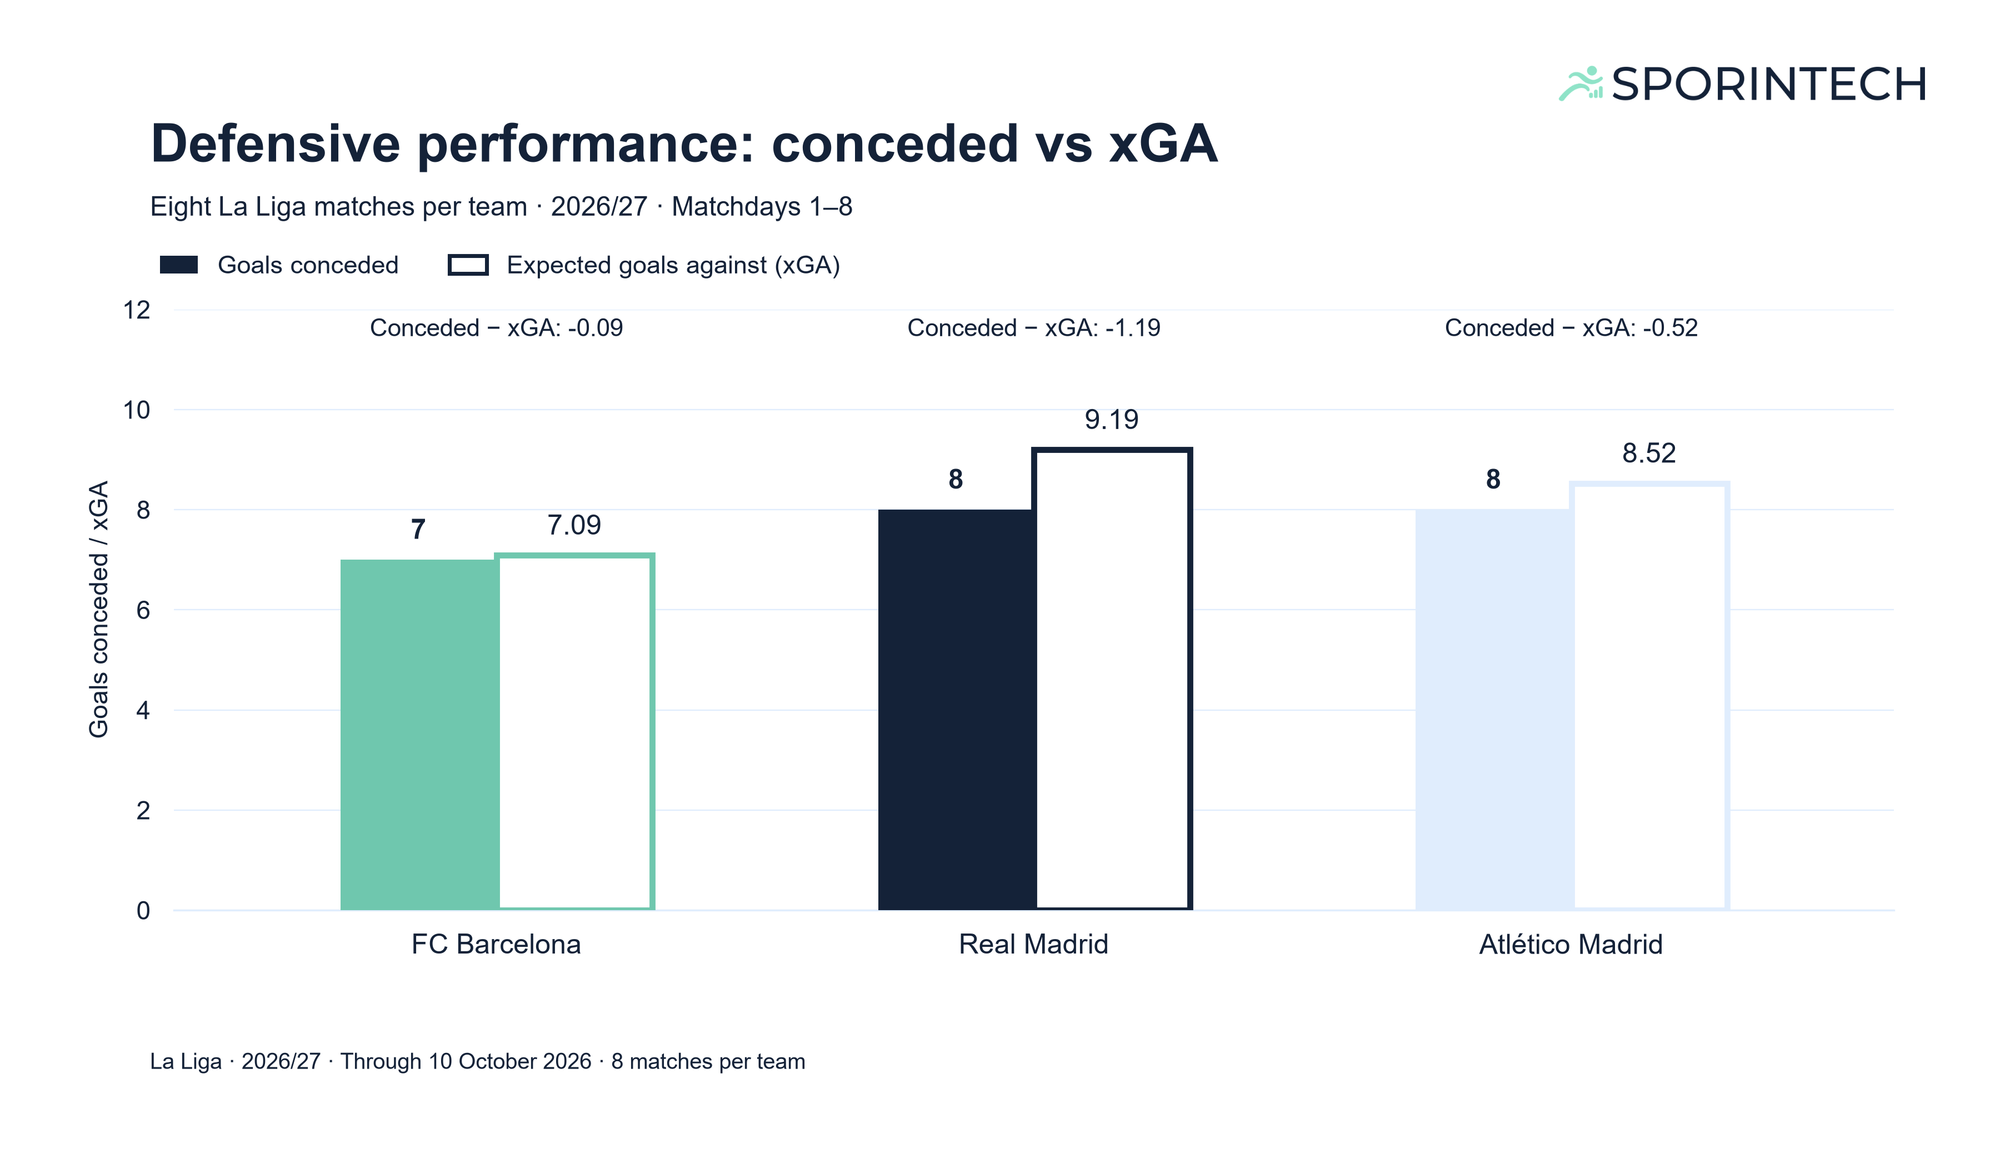
Barcelona have conceded seven goals in their first eight matches.
Their expected goals against, or xGA, stand at 7.09. This metric measures the quality of the scoring opportunities allowed to opponents and estimates how many goals those chances would typically produce.
Just as with xG, the total xGA is calculated by adding together the values from the eight individual matches.
The difference between Barcelona's actual goals conceded and xGA is therefore minimal.
This is an important distinction from their attacking performance. While Barcelona have scored substantially more goals than expected, their defensive results closely match the underlying model.
Barcelona also have the lowest total xGA among the three teams examined, ahead of Atlético Madrid with 8.52 and Real Madrid with 9.19.
Figure 3 compares actual goals conceded with expected goals against for all three teams, highlighting Barcelona's lower xGA and the close alignment between their actual and expected goals conceded.
These numbers suggest that Barcelona's defensive record is supported by relatively effective chance prevention, rather than an unusually large difference between expected and actual goals conceded.
However, the aggregated figures do not mean that Barcelona defended equally well in every match.
4. Eight victories, but different performances
Looking at individual matches provides a more detailed picture of Barcelona's start.
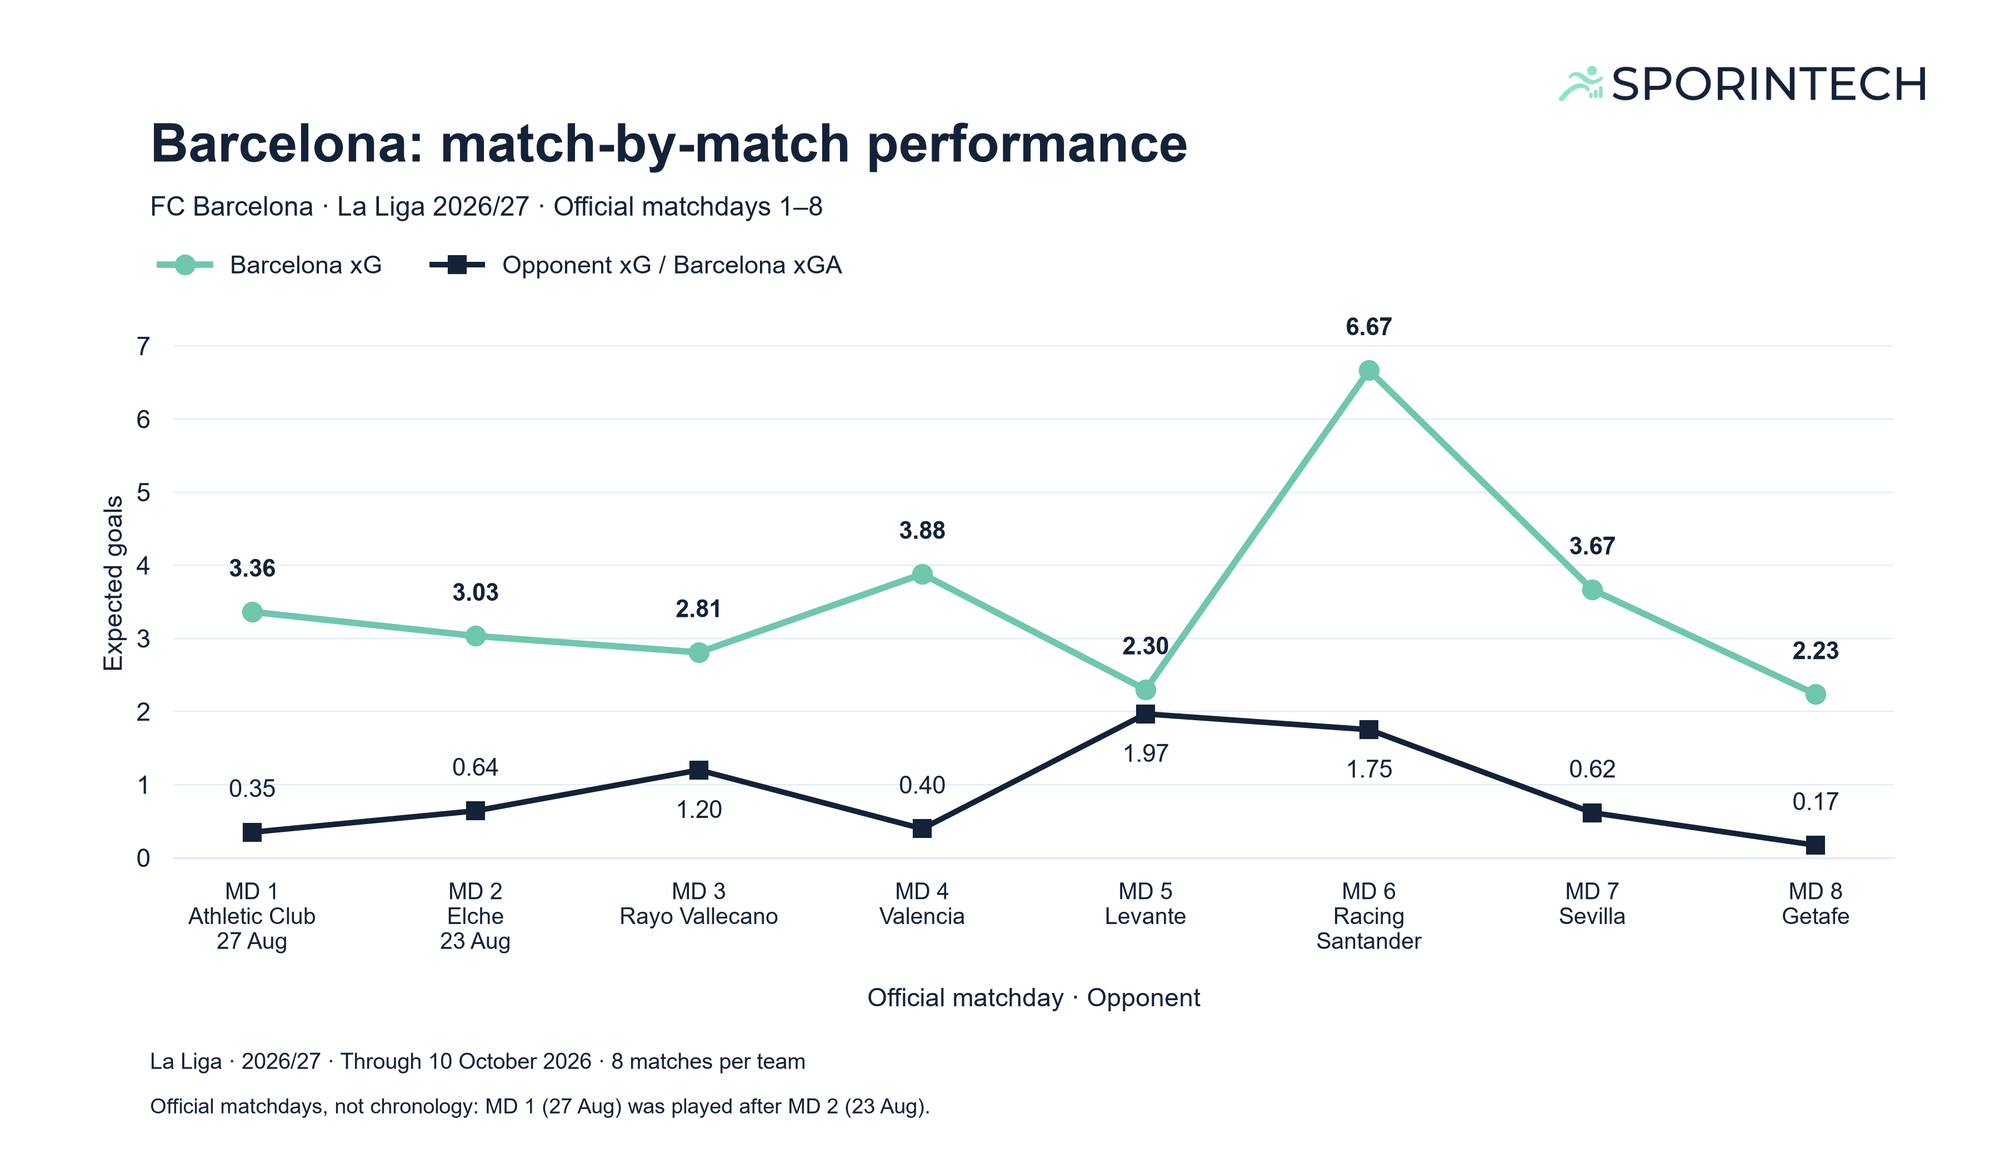
One finding stands out: Barcelona generated more xG than their opponents in all eight league matches.
This indicates that their positive chance balance has been consistent across the opening fixtures, even though the size of that advantage has varied considerably.
Against Valencia, Barcelona generated 3.88 xG while allowing just 0.40 xGA. Against Getafe, the figures were 2.23 xG and 0.17 xGA.
Both matches show a substantial advantage in the quality of chances created and conceded.
The situation against Levante was different.
Barcelona won the match 4 to 2, but generated only 2.30 xG compared with Levante's 1.97. Their expected points for this particular match were just 1.59.
Although Barcelona secured all three points, the underlying chance balance was much closer than the final score might suggest.
Another notable match was the 7 to 2 victory against Racing Santander. Barcelona produced 6.67 xG in that game alone, accounting for nearly 24% of their total expected goals across the eight matches.
Figure 4 provides a closer look at Barcelona's performances across all eight matches, highlighting how their advantage in expected goals varied from game to game.
This is worth keeping in mind when interpreting the overall figures. One particularly productive match can substantially influence the averages, especially early in a season.
5. Do 24 points reflect Barcelona's performances?
Barcelona's perfect record has produced the maximum possible 24 points from eight matches.
But their expected points tell a slightly different story.
Expected points, or xPts, estimate a team's average points return based on the modelled probabilities of winning, drawing or losing individual matches. These estimates are based on the statistical assessment of the chances created and conceded.
Barcelona accumulated 20.52 xPts across their opening eight fixtures. This figure represents the sum of the expected points calculated separately for each match.
Compared with their actual total of 24 points, Barcelona therefore exceeded their expected return by 3.48 points.
That is an exceptionally strong expected return within this comparison, but it also suggests that Barcelona's actual results have been even better than their underlying chances would typically lead us to expect.
Interestingly, Atlético Madrid show an even larger positive difference. They have collected 19 points from 14.45 xPts, exceeding expectations by 4.55 points.
Real Madrid, meanwhile, have collected 18 points compared with 16.04 xPts, a positive difference of 1.96.
Barcelona therefore lead the three teams in both actual and expected points, but Atlético have the largest positive gap between the two measures.
Figure 5 compares actual and expected points for all three teams, illustrating how their results differ from the statistical expectations.
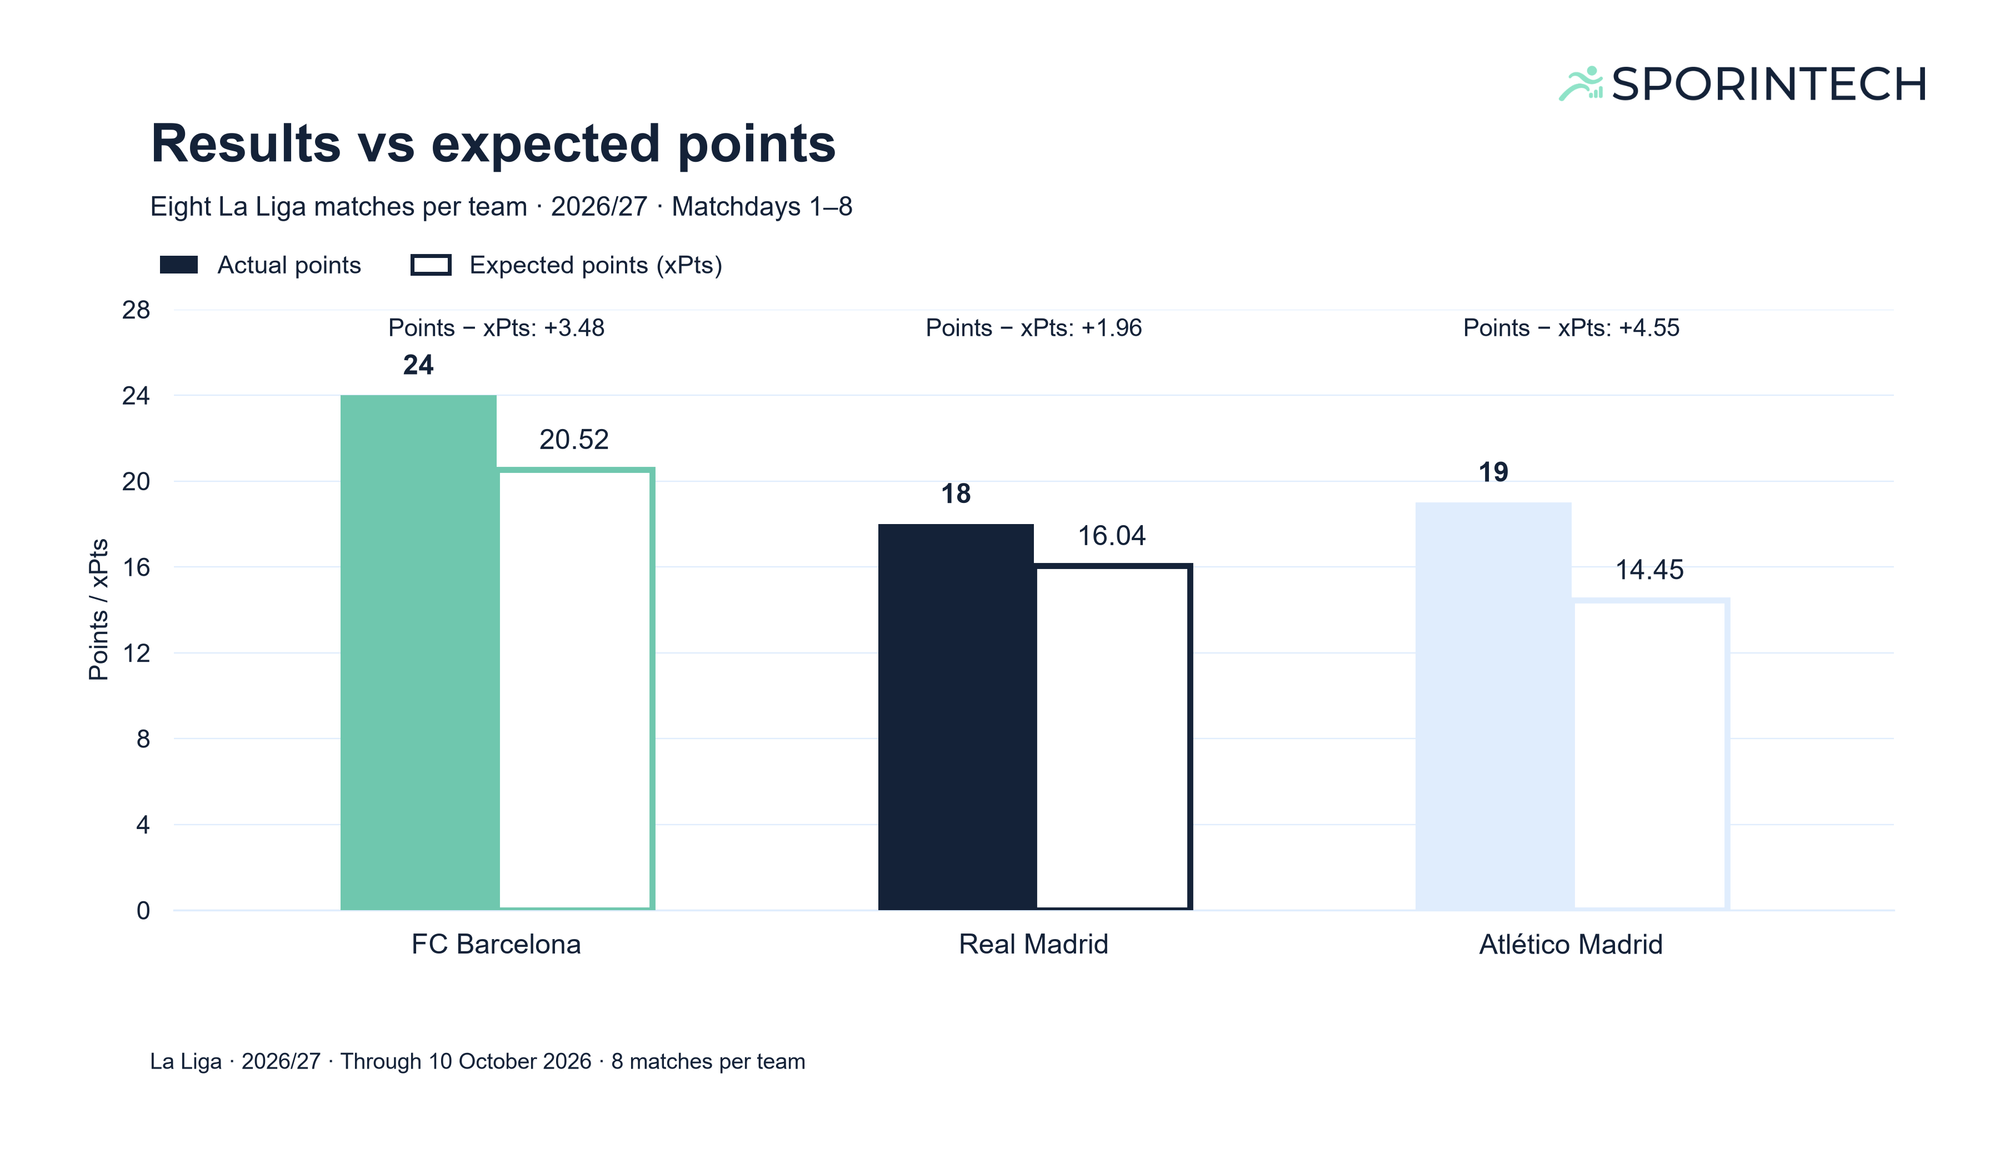
Expected points (xPts) estimate the points a team would be expected to earn from matches already played, based on a statistical model.
A team can perform strongly and still collect more points than expected. Barcelona's start illustrates precisely that combination.
6. Conclusion: Strong performances, even stronger results
Barcelona's perfect start is more than an impressive sequence of results.
Their underlying statistics show substantial attacking advantages over Real Madrid and Atlético Madrid in this eight match sample. They generate more shots, create higher quality opportunities on average and have accumulated considerably more expected goals.
Barcelona's defensive numbers also indicate a strong start. With 7.09 xGA, they have allowed the lowest expected goals against among the three teams. Their seven actual goals conceded are also closely aligned with the statistical expectation.
At the same time, Barcelona's 34 goals exceed their xG by 6.05, while their 24 points are 3.48 above their expected points total.
The distinction matters.
Barcelona's success is supported by strong underlying performances, but the perfect record also reflects results that have exceeded statistical expectations.
For now, Barcelona's attacking and defensive numbers underline the strength of their perfect start. Whether that additional advantage will continue remains an open question.
And with a potential ninth consecutive victory approaching, the next chapter of their season could also be a historic one.
Data and Methodology
This analysis examines the first eight La Liga matches of FC Barcelona, Real Madrid and Atlético Madrid in the 2026/27 season, using data through 10 October 2026.
Expected metrics are based on statistical models, with individual match values aggregated across the eight fixtures. Shots per match are calculated as total shots divided by eight, while xG per shot represents total xG divided by total shots.
The comparison reflects the teams' performances during this period without adjusting for differences in opponent strength or match circumstances.