
Florian Wirtz at Liverpool: Is the Criticism Justified?
Florian Wirtz's performances at Liverpool have drawn criticism. But is it justified? We compare his performance data with his time at Leverkusen.

When Florian Wirtz joined Liverpool in the summer of 2025, expectations were high. At Bayer Leverkusen, he had established himself as one of Europe's most influential attacking midfielders, combining goalscoring, creativity and the ability to beat opponents with the ball.
More than a year later, his performances remain under scrutiny. In October 2026, Reuters reported on the criticism surrounding his contributions, while The Guardian examined why he has struggled to reproduce his Leverkusen form.
Much of the discussion focuses on goals and assists. But these figures alone cannot describe the full contribution of an attacking midfielder.
We compared Wirtz's final Bundesliga season in 2024/25 with his first Premier League campaign in 2025/26 and the opening seven league matches of 2026/27. By examining goals, shooting activity, key passes, dribbling and defensive actions, we can identify which aspects of his statistical profile have changed since the move.
1. Goalscoring and shooting: Fewer goals, fewer attempts
The most visible difference concerns Wirtz's goalscoring output.
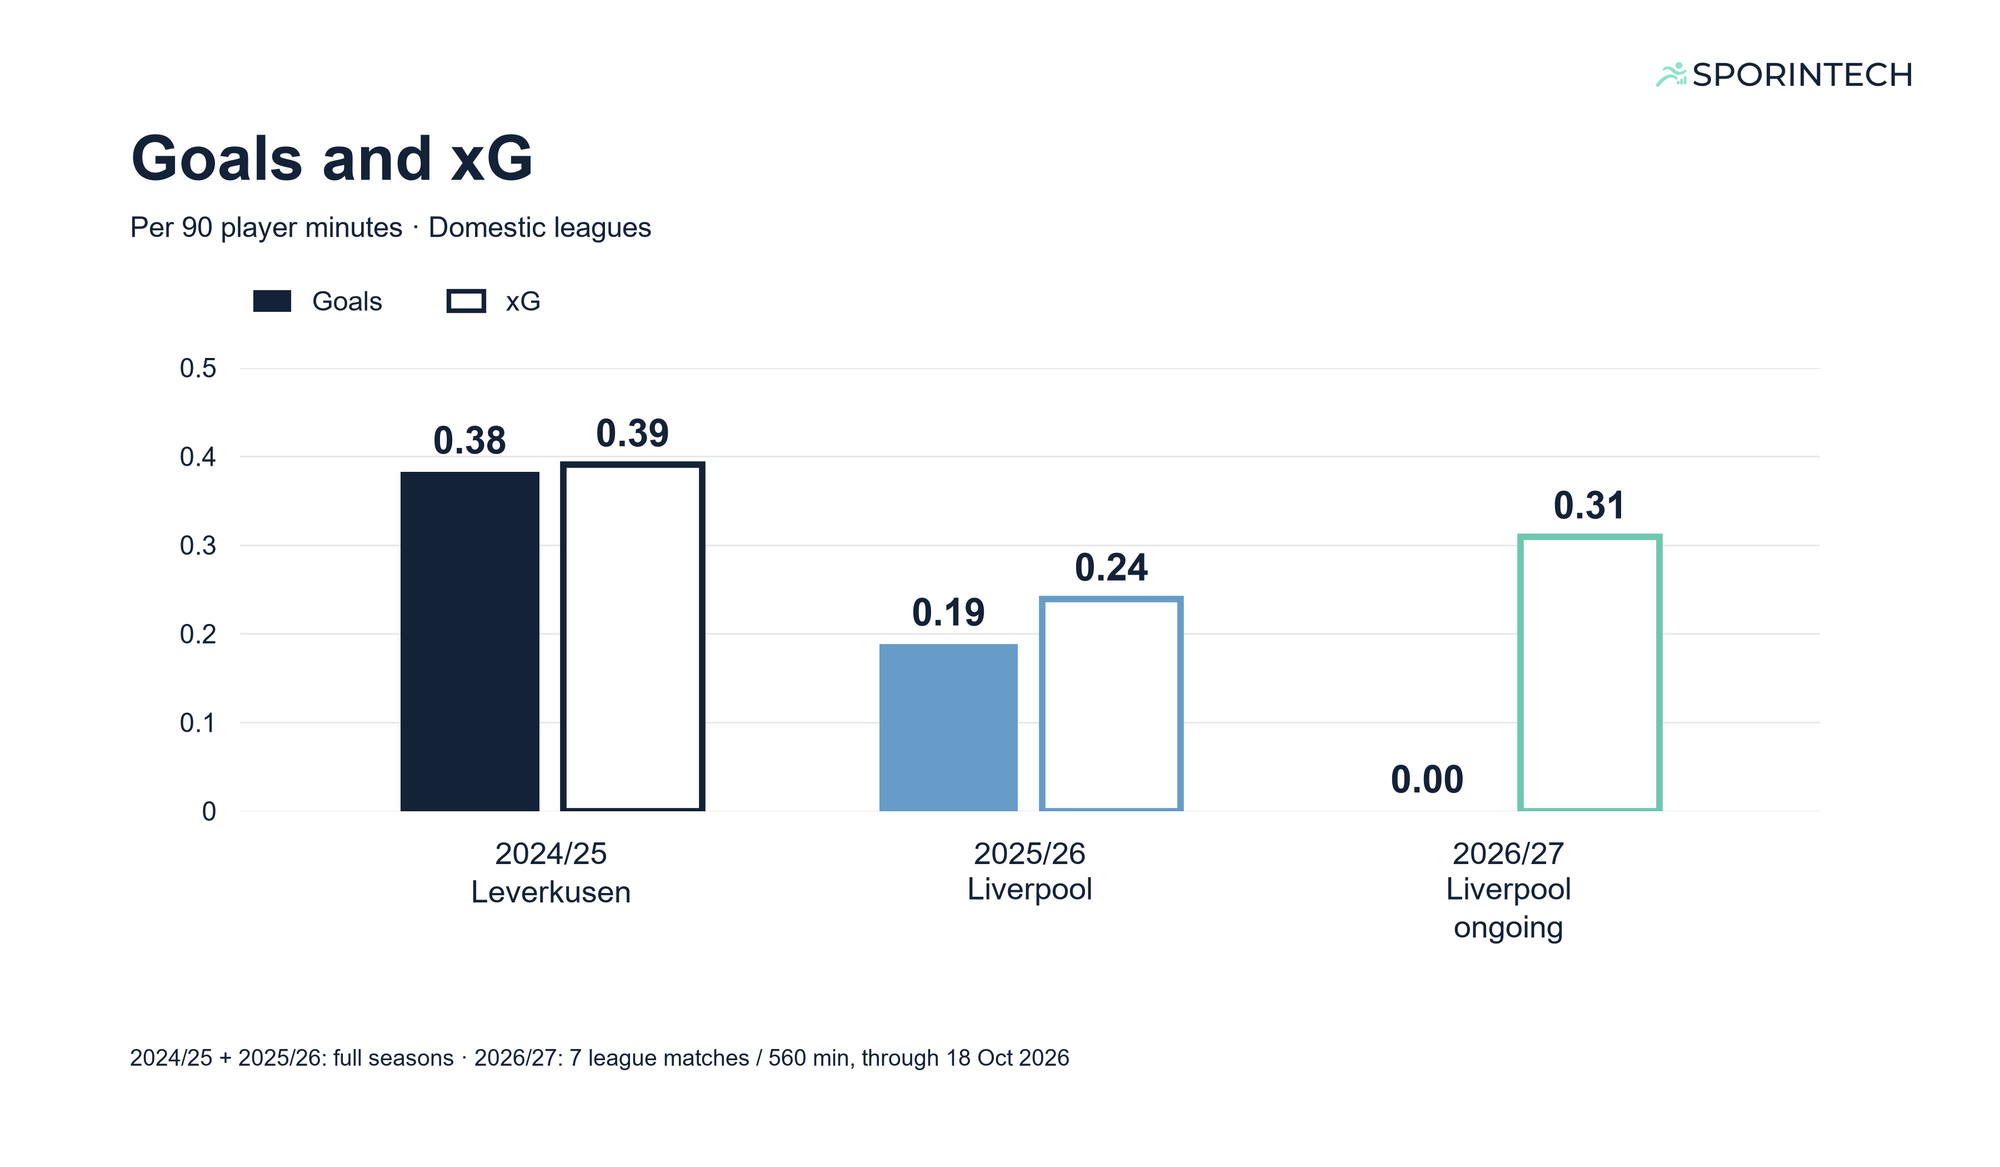
During his final Bundesliga season, he scored 10 goals in 2,354 minutes, equivalent to 0.38 goals per 90 minutes. In his first Premier League season, he scored five goals in 2,389 minutes, reducing his scoring rate to 0.19 per 90.
After seven league matches in 2026/27, he has yet to score.
Expected goals (xG), which estimates the likelihood of shots resulting in goals based on their characteristics, adds important context.
At Leverkusen, Wirtz generated 0.39 xG per 90 minutes, compared with 0.24 during his first Liverpool season. That figure has increased to 0.31 in the current campaign.
Despite having no goals this season, he has accumulated approximately 1.92 xG across 560 minutes. His underlying scoring opportunities have therefore increased compared with his first Liverpool season, even though his actual goalscoring output has not followed.
Figure 1 illustrates the contrasting development of goals and xG across the three seasons.
To understand this development, it is useful to examine his shooting activity.
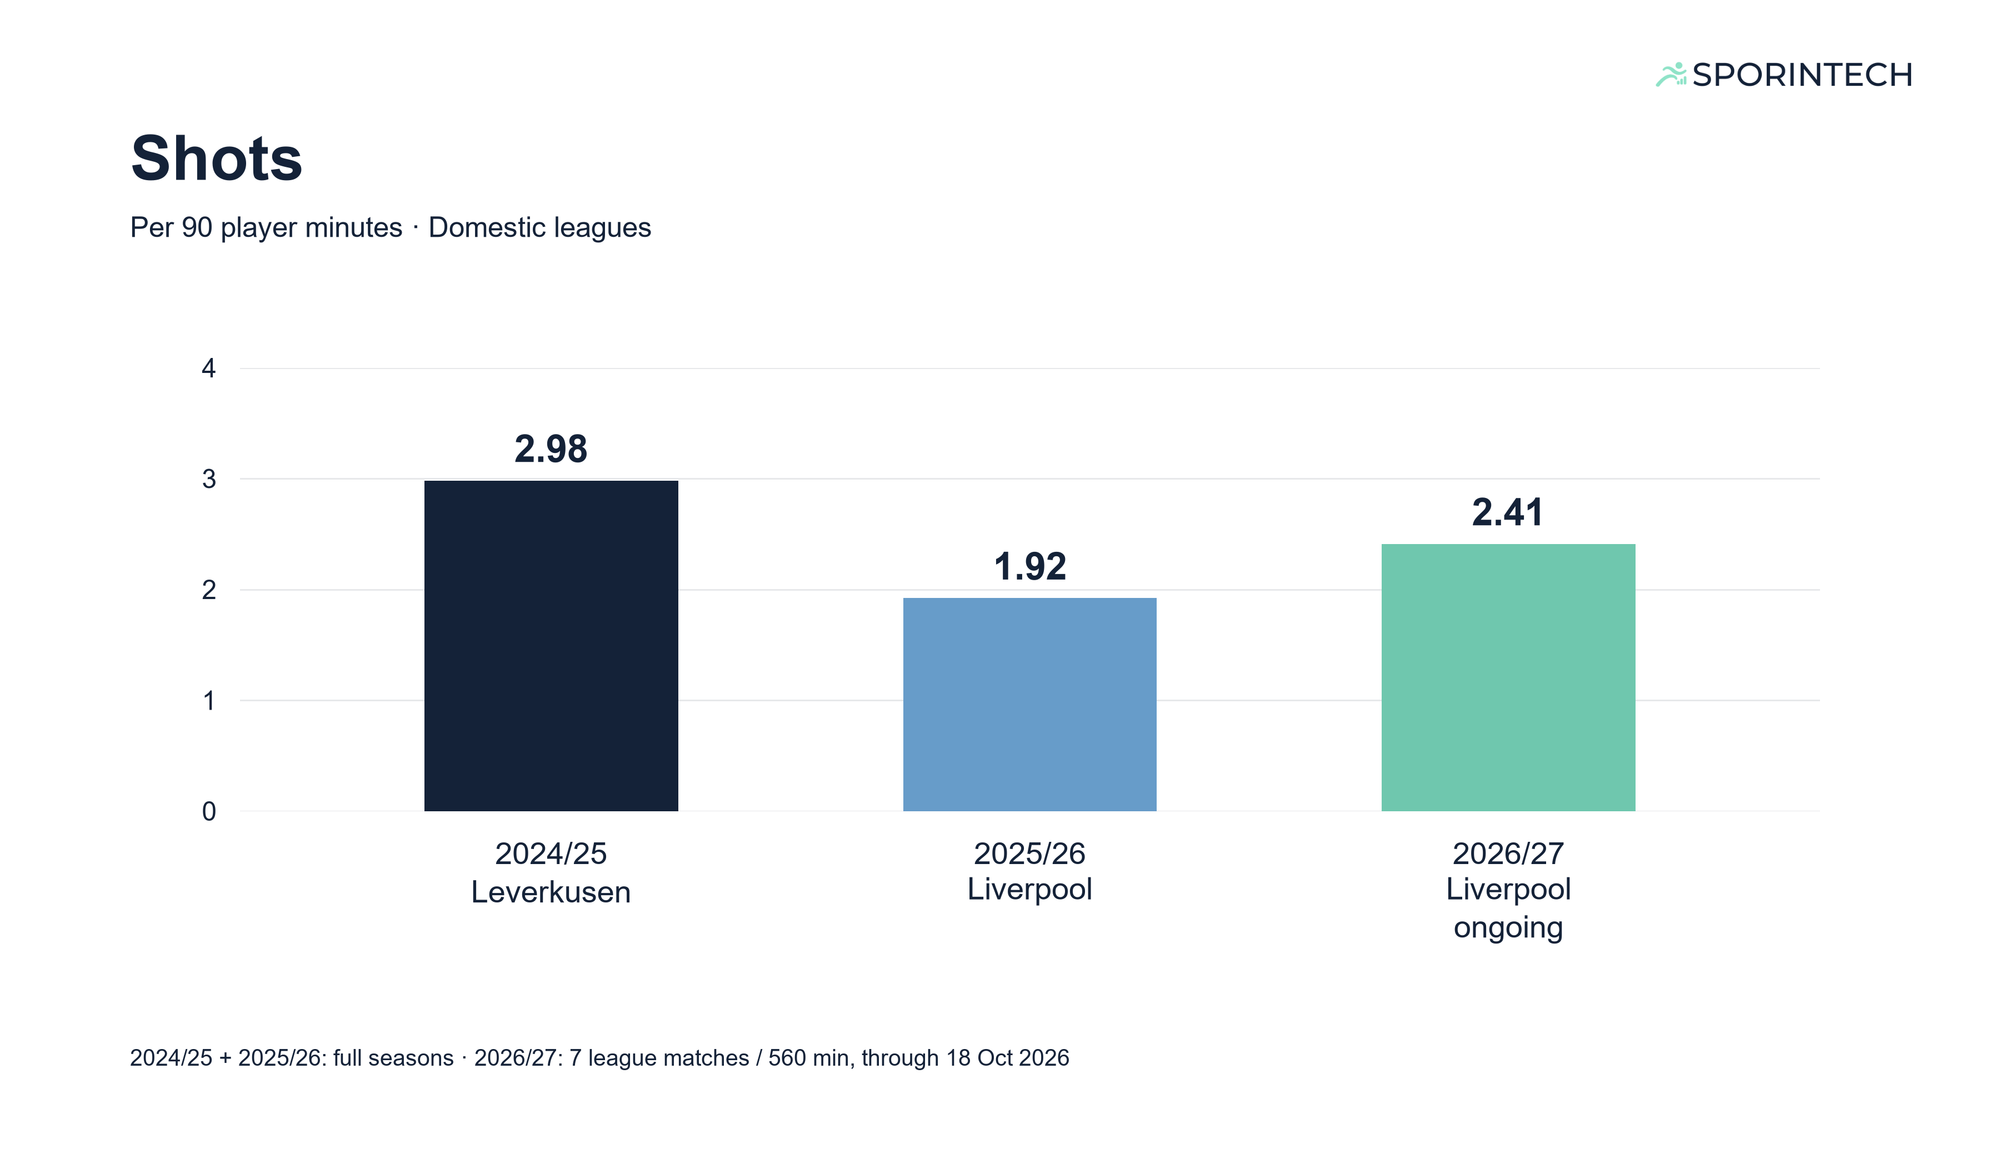
Wirtz attempted 2.98 shots per 90 minutes at Leverkusen in 2024/25. That rate fell to 1.92 during his first Liverpool season, a reduction of approximately 36%.
In the current season, his shooting frequency has partially recovered to 2.41 shots per 90, as shown in Figure 2.
The average expected quality of these attempts has changed considerably less.
His xG per shot was 0.131 at Leverkusen, 0.124 in his first Liverpool season and 0.128 in the current campaign.
This distinction is important. Wirtz's lower goalscoring output during his first Liverpool season was accompanied by a substantial reduction in shooting frequency, while the average quality of his attempts remained relatively similar.
The figures therefore suggest that the number of shooting opportunities changed more substantially than their average quality.
They establish what changed in his shooting profile, rather than why he found himself taking fewer shots.
2. Creativity and dribbling: Two different developments
Goalscoring is only one dimension of Wirtz's attacking contribution.
Key passes offer another perspective. These are passes that directly lead to a teammate's shot, regardless of whether the attempt results in a goal.
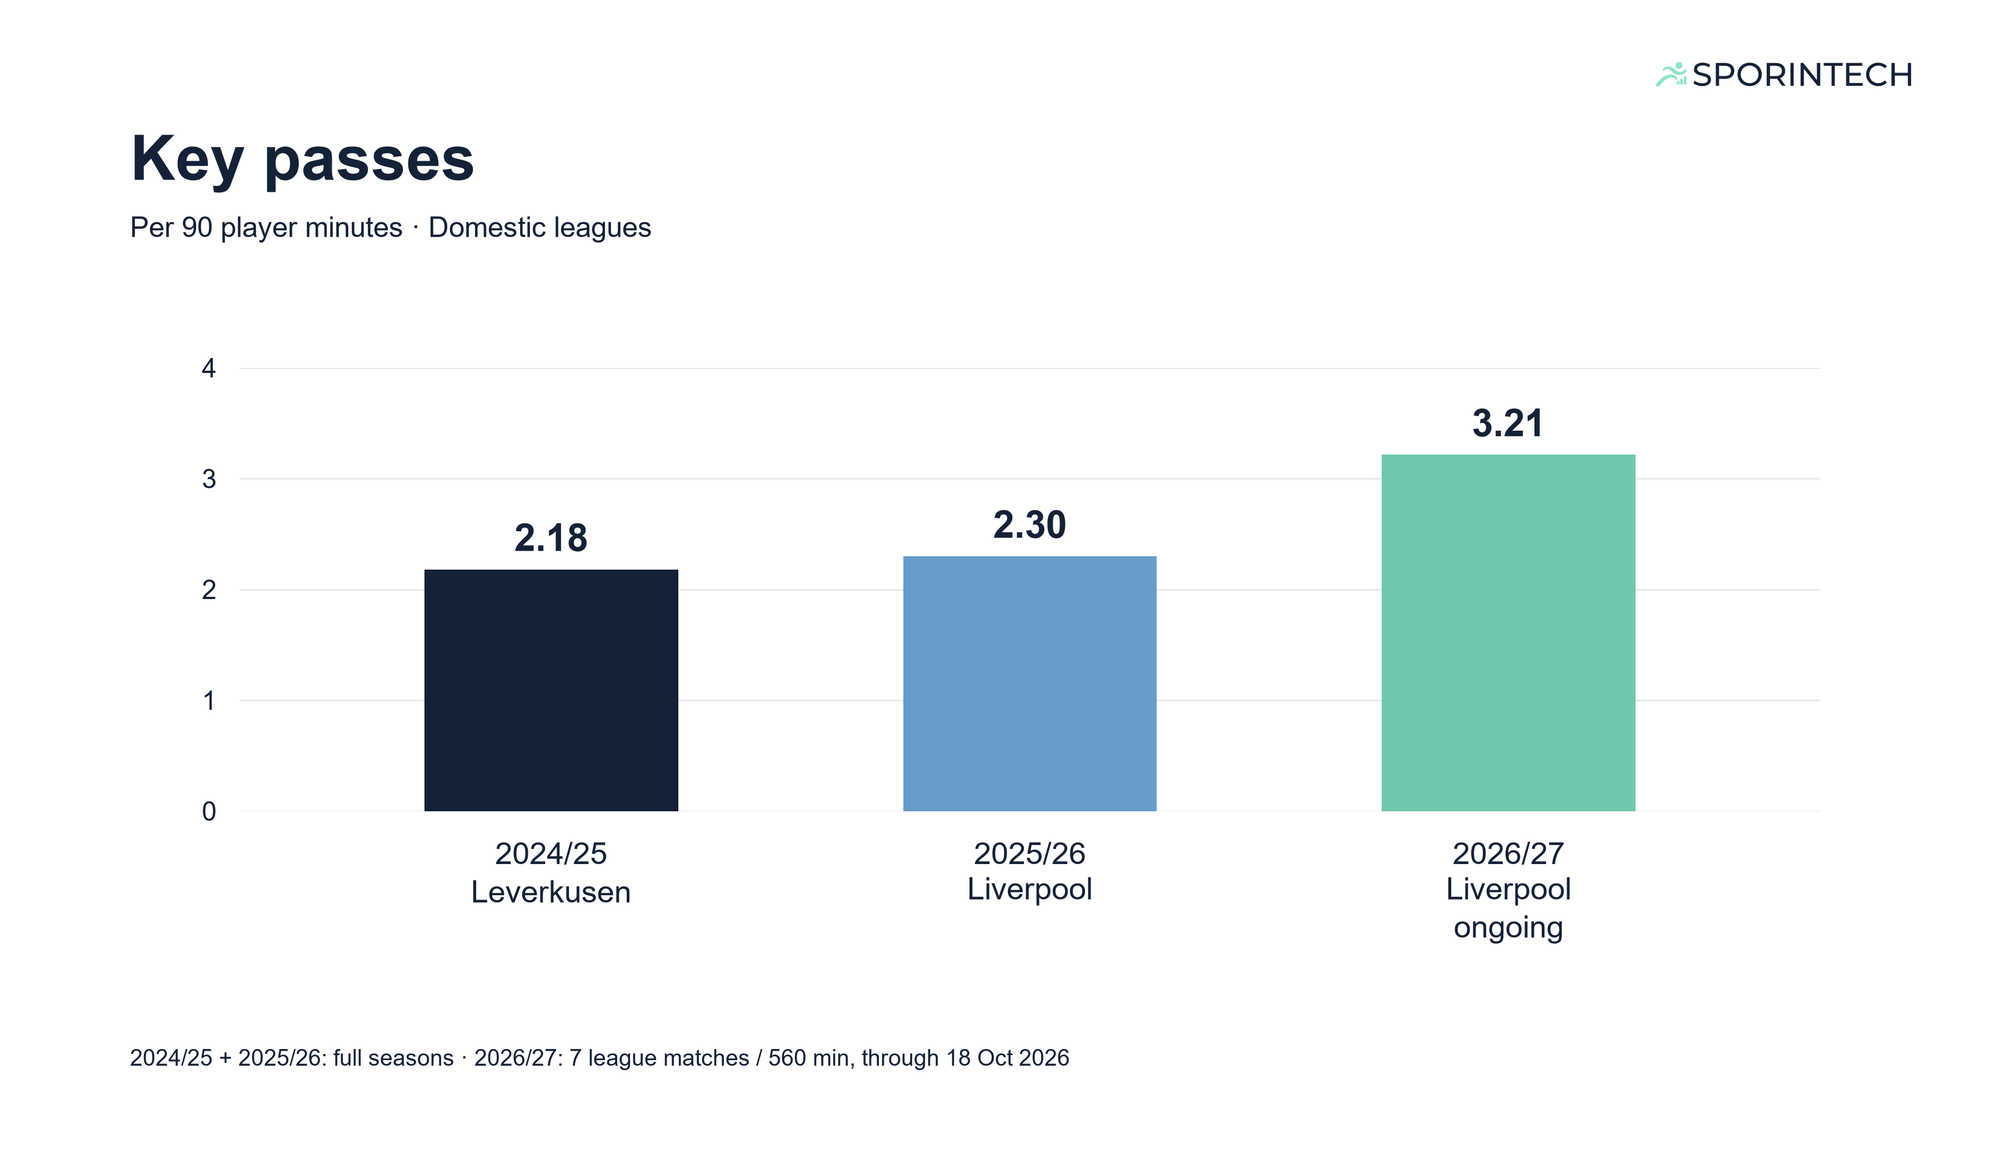
In his final Leverkusen season, Wirtz recorded 2.18 key passes per 90 minutes. His rate increased slightly to 2.30 during his first Liverpool season and currently stands at 3.21.
Figure 3 shows how his recorded chance creation through passing has developed differently from his goalscoring output.
While Wirtz has scored less frequently since moving to Liverpool, his recorded involvement in creating shooting opportunities for teammates has remained strong.
The current rate is the highest of the three samples, although it represents only seven league matches. It is therefore better understood as an early-season figure than as evidence of a permanent improvement in creativity.
His dribbling statistics reveal a very different pattern.
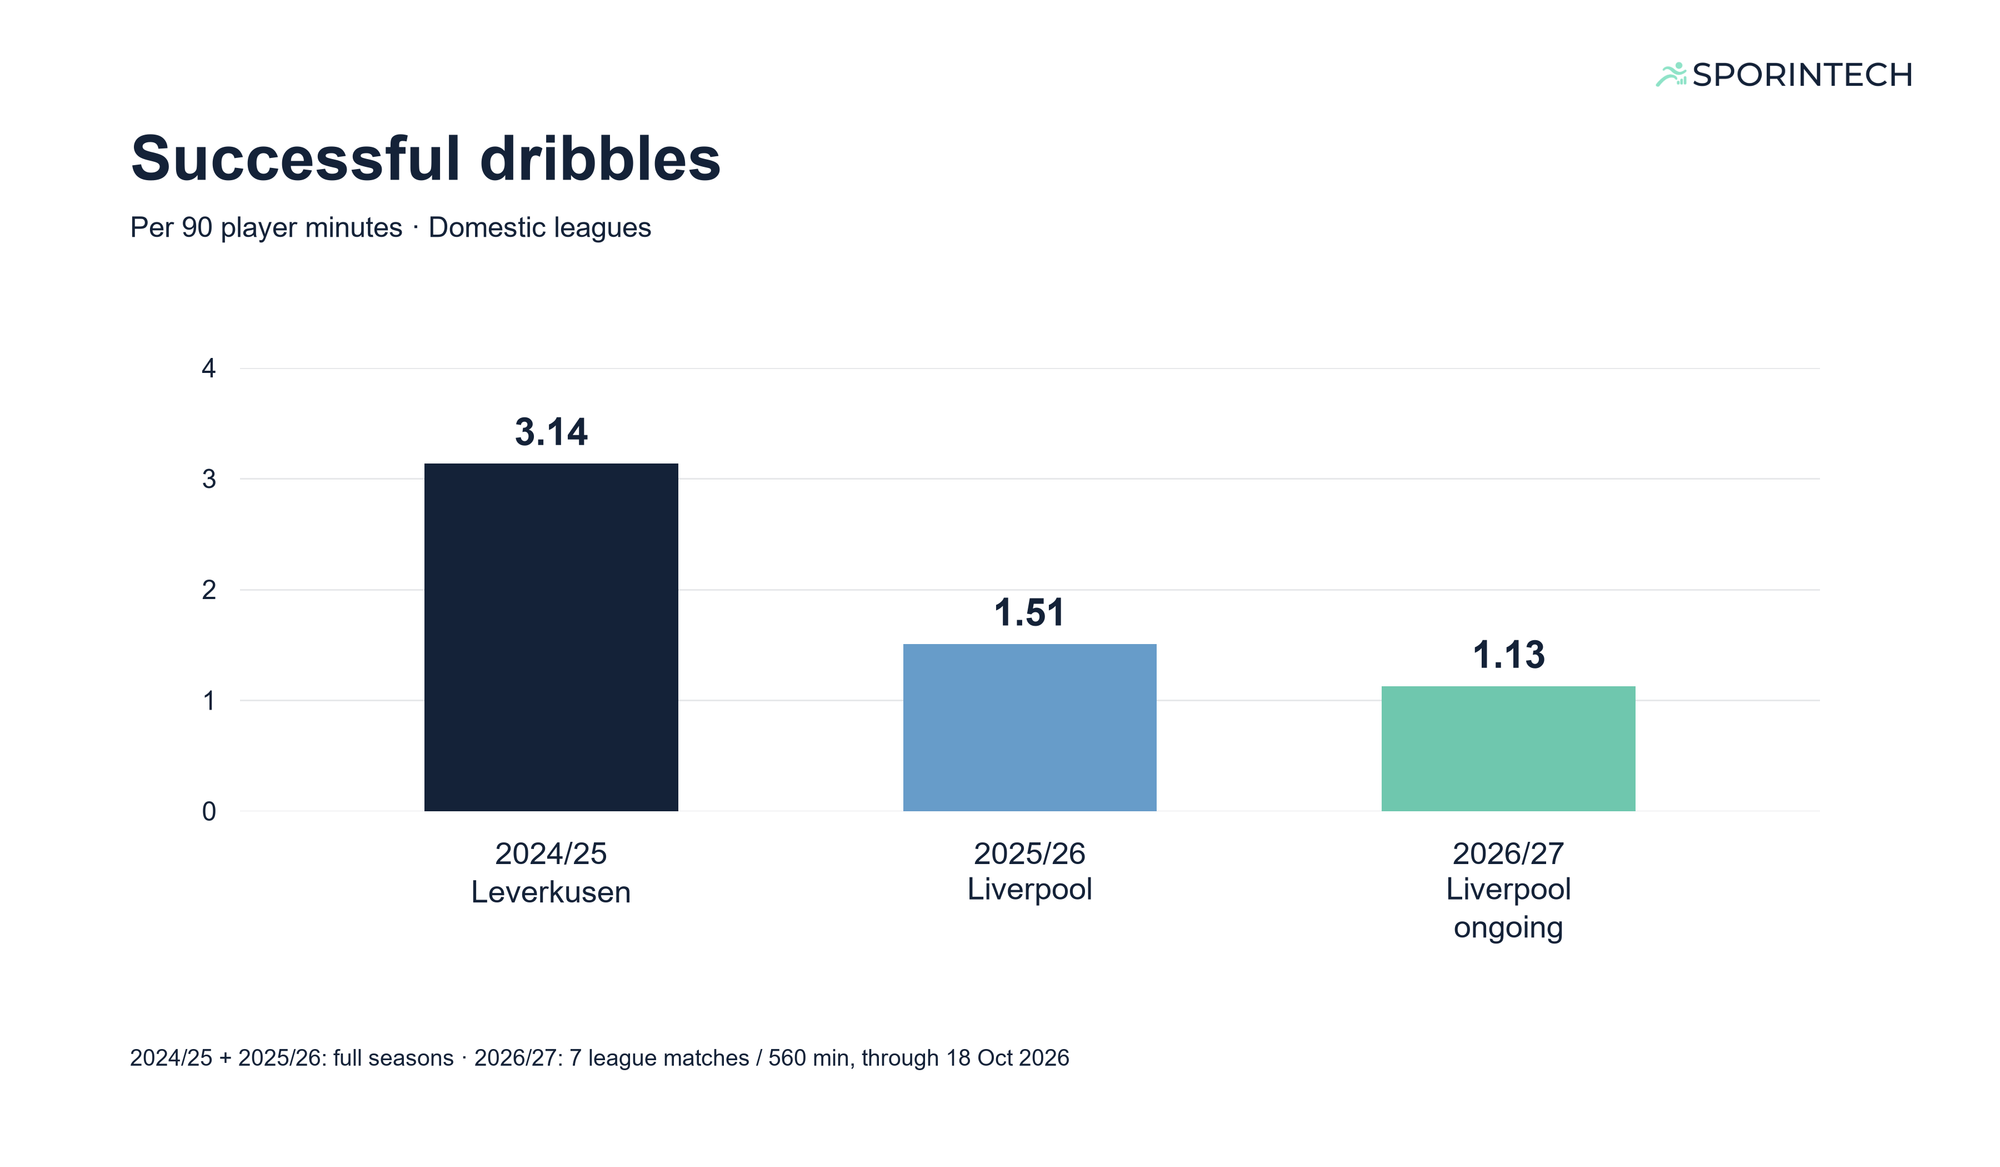
At Leverkusen, Wirtz completed 3.14 successful dribbles per 90 minutes. That figure dropped to 1.51 in his first Liverpool season and currently stands at 1.13.
The substantial reduction is visible in Figure 4.
The decrease becomes more informative when we examine how frequently he attempts to dribble.
His dribble attempts declined from 6.16 per 90 minutes at Leverkusen to 2.86 during his first Liverpool season. The current figure is 2.57.
His success rate, however, remained comparable between the first two periods: 50.9% at Leverkusen and 52.6% at Liverpool.
In other words, Wirtz attempted considerably fewer dribbles during his first Liverpool season, but he was not less successful in the attempts he made.
His current success rate is lower at 43.8%, although that figure is based on only 16 attempts.
Together, these results reveal an important change in his attacking activity.
Wirtz takes on opponents much less frequently than he did at Leverkusen, while his recorded contribution to creating shots through passing has remained relatively strong.
The two trends are not contradictory. They describe different ways of contributing to attacking play.
3. Defensive involvement: A different picture
A change in attacking activity does not necessarily imply a similar change in defensive involvement.
To investigate this, we examined Wirtz's recorded tackles per 90 minutes.
At Leverkusen in 2024/25, he averaged 1.30 tackles per 90. His first Liverpool season produced a nearly identical figure of 1.28, while the current season stands at 1.45.
Figure 5 shows that his tackle frequency has remained relatively stable across the three periods.
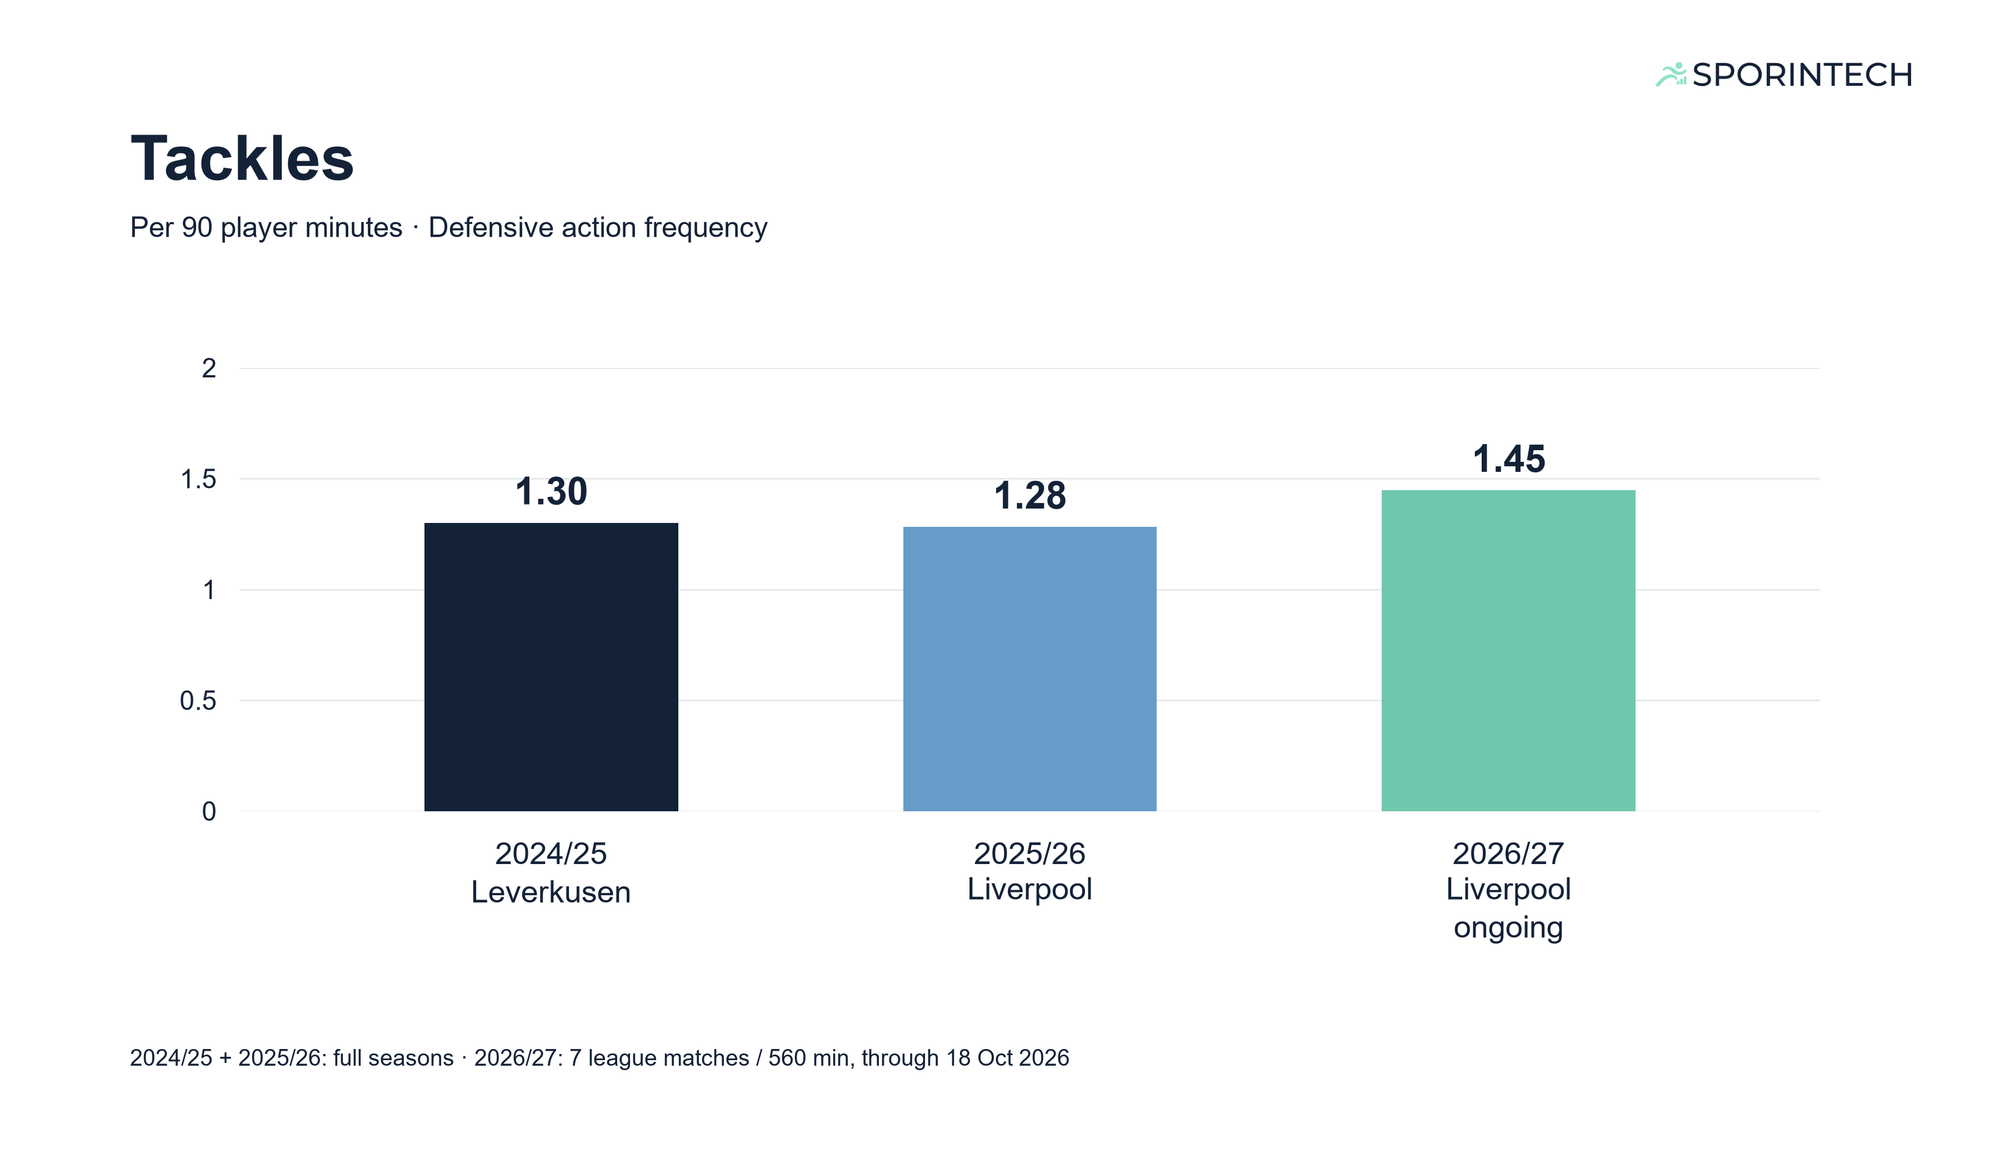
Unlike his shooting and dribbling activity, Wirtz's tackle frequency has remained relatively stable across the three periods. The decline in certain attacking actions has therefore not been accompanied by a comparable reduction in recorded tackles.
However, tackle frequency describes how often a player performs these actions, not how successfully he defends overall. It does not measure positioning, pressing intensity or the quality of his defensive decisions.
Conclusion: A changing attacking profile, not a uniform decline
Florian Wirtz's goalscoring frequency, shooting volume and successful dribbles declined substantially during his first Premier League season. The reduction in shooting opportunities is particularly relevant because the average expected quality of his shots remained relatively similar.
At the same time, his key-pass figures followed a different trajectory. His recorded contribution to creating shooting opportunities for teammates remained strong and has increased in the current sample.
His tackle frequency has also remained broadly stable.
The criticism of Wirtz's reduced goalscoring output is supported by the statistics. However, the examined metrics do not establish a decline across all areas of his game. Instead, the evidence points to a change in his statistical profile.
For Liverpool, the next development to watch is whether his recovering shooting activity and continued creative involvement begin to translate into more goals.
Methodology
This analysis compares Florian Wirtz's domestic league performances across three periods: Bayer Leverkusen in 2024/25, Liverpool in 2025/26 and Liverpool's first seven completed league matches in 2026/27, through 18 October 2026.
The samples cover 31 appearances and 2,354 minutes, 33 appearances and 2,389 minutes, and seven appearances and 560 minutes, respectively.
Performance metrics are expressed per 90 minutes where applicable. These values are calculated by dividing the recorded season totals by total playing minutes and multiplying by 90. Goals and playing minutes were cross-checked against match records.
The comparison is descriptive and does not adjust for differences in league strength, team context, tactical roles, opponents or possession opportunities. The 2026/27 figures represent an early-season sample, while the other two periods cover complete league seasons.